Components Study Outcome Predictor
This interactive visualization helps you understand how the different components of a flexible healthy relationship program (called REAL Essentials Advance) can, when combined, produce differing levels of change for youth’s outcomes. You can select components in categories such as content (for example, substance use), activity (for example, interactive activities), or dosage (for example, duration of programming) to see how much outcomes can improve when their components combine.
This visualization is an interactive presentation of some findings from the Components Study of REAL Essentials, which included more than 1,300 youth and was funded by the Office of Population Affairs.
This visualization works best on Google Chrome and mobile. We do not keep any information you submit while you use the visualization.
Why might I use this website? What if I need more help?
See the page for more information about this website, the page for more information about the Components Study, and the for help on how to enter information and interpret the results.
Home
Glossary
- Activities
- A category of program components that document the intended principles and practices by which the content is provided. The delivery mechanism categories used in the study include the following:
- Interactive activities include interactive delivery methods such as discussions, games, or role playing.
- Home-based activities include activities intended to be completed outside of the implementation setting.
- Norm-setting activities include introducing and establishing group norms or program goals, such as through icebreaker activities
- Passive multimedia activities include viewing or listening to pictures, videos, audio, or social media.
- Passive traditional activities include viewing or listening to readings, experiments, or didactic lessons.
- Content
- A category of program components that document the intended subject matter of the program. The content categories used in the study include the following:
- Academic success content addresses youth’s options and plans for pathways to academic success.
- Emotional health content addresses intrapersonal processes and strengths.
- Individual values content addresses youths’ personal belief systems.
- Sexual behavior content includes content that addresses the physical behaviors related to sexual activity, its preconditions (such as puberty), and its potential consequences (such as pregnancy).
- Sexuality content addresses the non-physical behaviors and experiences related to healthy sexual behavior, its preconditions (such as consent), and its potential consequences (such as healthy relationships).
- Social health content addresses interpersonal skills, relationships, and belief systems.
- Substance use content addresses the avoidance of, reduction of, and risks related to using substances.
- Core components
- Program components that developers or other key stakeholders consider to be important to the program. They may be central to the program based on hypotheses around the theory of change of the program, or they may be based on existing evidence that demonstrates that they favorably affect outcomes.
- Dosage
- A category of program components that document the intended duration, frequency, and intensity of the program.
- Percentile rank
- The percentage of scores in a distribution that are lower than the observed one. In the Components Study Outcome Predictor, the percentile rank represents the percentage of outcome changes in the Components Study of REAL Essentials (a study of over 1,300 youth) that were smaller in magnitude than the one predicted by the set of selected components.
- Program
- The set of activities or planned experiences; this may include a curriculum and potentially other intended experiences of participants.
- Program components
- The individual elements or activities that constitute a program.
About this study
This visualization was developed as part of the Components Study of REAL Essentials, a descriptive study funded by the Office of Population Affairs that included more than 1,300 high-school-age youth. This study provides insight into the roles that components play as predictors of youth’s outcomes. The reports at the bottom of this page provide the study’s findings about components, implementation, outcomes, and engagement. The Anastasio et al. (2025) paper offers deep insight into components as predictors of outcomes and the information we used to inform the calculations shown in this website. The Knab et al. (2025) and Asheer et al. (2025) reports provide insight into the amounts of each components we saw in the study. Cole et al. (2025) provides more information about the study design and sample.
References for the Components Study:
Knab, J., R. Cole, and D. Aharpour. (2025) “Components Study of REAL Essentials: Topics, Lessons, and Components Selected to Meet Youth Needs.” Office of Population Affairs.
Asheer, S., and E. Blesson. (2025) “Components Study of REAL Essentials: Untangling Program Implementation, Context, and Quality.” Office of Population Affairs.
Anastasio, J., E. Forrester, and R. Cole. (2025) “Components Study of REAL Essentials: The Role of Components Influencing Outcome Change.” Office of Population Affairs.
Walzer, J., L. Cattell, and A. Meckstroth. (2025) “Components Study of REAL Essentials: The Role of Youth Engagement in Program Implementation and Youth Outcomes.” Office of Population Affairs.
Cole, R., J. Walzer, J. Anastasio, and J. Knab. (2025) “Components Study of REAL Essentials: Design Report.” Office of Population Affairs.
References for Components of Teen Pregnancy Prevention programs
Forrester, E., and R. Cole. (2023) “Core Components of Teen Pregnancy Prevention Programs.” Office of Population Affairs.
The Components Study, including all reports and this website, was funded under a contract to Mathematica by the Office of Population Affairs (HHSP233201500035I/75P00120F37051).
About this visualization
This website is meant to teach you, in a more hands-on way than just reading reports and publications, how components and outcomes relate to each other. As you experiment with different sets and amounts of components, the Office of Population Affairs hopes that you will learn more about (1) the components as ingredients of teen pregnancy prevention programs generally and (2) the ways that they relate to outcomes in this particular descriptive study.
This visualization does not provide universal guidance about how components predict outcomes with all populations, in all settings, or when different programs use these same components. Rather, this website is intended to help you understand how to conceptualize components and know which components emerged as predictive of outcomes in this one study.
The findings summarized in this visualization are the results of exploratory analyses, and they have the following limitations:
- We did not set up true experiments (such as a randomized controlled trial) on these components, so the findings are not causal estimates of how components relate to outcomes. In other words, we cannot say that Component A directly led to Outcome B.
- This website visualizes findings based on analyses that examined the types of components (for example, content, delivery mechanism, dosage) independently. Although Forrester and Cole (2023) write that components of different types operate in combination (for example, content about sexual health might be delivered in a lecture for a 15-minute dose in an in-person setting), we could not practically estimate the combined effects of components of multiple types together in this study. Therefore, these coarse findings might hide some of this nuance.
- The findings shown here about components of REAL Essentials Advance as implemented in this study might not translate to how components operate in different programs, in different settings, or with different populations.
- When you think about how you might add components to (or subtract components from) a program to improve outcomes, it is important to consider how you place components in your program implementation. For a component to integrate well and achieve the intended outcome improvements, you might have to include more context or foundational content, as appropriate.
- To help you interpret the visualization and increase the reliability of its measurement, we combined closely related components into one (for example, we combined 12 social health content components that addressed interpersonal skills, relationships, and belief systems into a single component). The findings cannot account for differences within the components that we combined.
- For all outcomes, it may not be feasible to produce predicted changes representing at or close to the minimum (1 percentile) or maximum (99 percentile) ranges. This is because the different components experiences we saw in the Components Study were not the sole factors that caused different levels of improvement in youth outcomes.
- This website presents findings only from the short-term follow-up, and focuses on proximal outcomes. Some (but not all) of these findings between components and outcomes were consistent with analyses examined at a longer-term follow-up period. To see findings for the long-term follow-up, see Anastasio et al (2025) and Walzer et al (2025).
Method
The Components Study Outcome Predictor shows improvement on outcomes based on three analyses:
- Analysis 1: Estimation of how components relate to outcomes. To estimate what a component (for example, dose, content, or activities) contributes as a predictor of an outcome, we conducted multilevel regression analyses. We regressed each follow-up outcome variable on (1) component variables of interest; (2) a baseline measure of that outcome; and (3) a robust set of empirically and theoretically supported baseline covariates, including youth demographics and school characteristics. More information on this analytic approach, as well as findings for all component predictors and outcomes, is available in in Anastasio et al. (2025).
- Analysis 2: Estimation of the outcome score associated with the components and lessons you selected. Using the parameter estimates from the Components Study described in Analysis 1, as well as the component counts you select, the website computes an estimate for each outcome you select. The predicted outcome is a function of the sum of the calculated parameter estimates for each component multiplied by the quantification (for example, the number of lessons or the hours of dosage) for a given component (the model also uses as inputs the average values of youth demographics and school characteristics).
- Analysis 3: Transformation of the outcome score into a percentile rank. Finally, the website transforms each average outcome score relative to the distribution of outcome changes we saw in the Components Study. We use Kernel Density Estimation to create a smoothed density curve based on the deciles of each outcome, and then we compare the observed model-based average relative to the smoothed density curve to calculate a percentile rank for each outcome’s change. (Note – the approach of transforming outcomes into percentile ranks was not used in Anastasio et al. [2025]. The percentile rank transformation was used for this website to visualize all outcomes in a more easily interpretable metric than the effect size scale used in the report.)
On the website, we report each outcome’s calculated percentile rank (from Analysis 3).
If users add or subtract lessons to each component, the website updates outcome scores based on the newly selected lesson counts, and the analyses described above. Note: the predicted outcome score will always change by a constant amount when a lesson is added or subtracted (e.g., when moving from 1 to 2 lessons or 11 to 12 lessons), given the linear modeling approach used in Analysis 2. We also show whether any of these updates are significantly different (larger or smaller) than the previous one by looking at the significance of the parameter estimate of the component that you changed (from Analysis 1).
User Guide
The goal of this interactive visualization, the Components Study Outcome Predictor, is for you to be able to see the connection between the amount that outcomes change and the different collections and combinations of components.
This tab provides additional guidance on ways to use and interpret the findings from the visualization. You can follow along with this example to understand how to use the website and to correctly interpret findings from the predictions.
As the default, the website presents results for five outcomes predicted by seven hours of dosage. We encourage you to change the amount of dosage, the selected component type, or the outcomes predicted by components by updating information in the panel on the right side of the website.
View predicted outcome changes
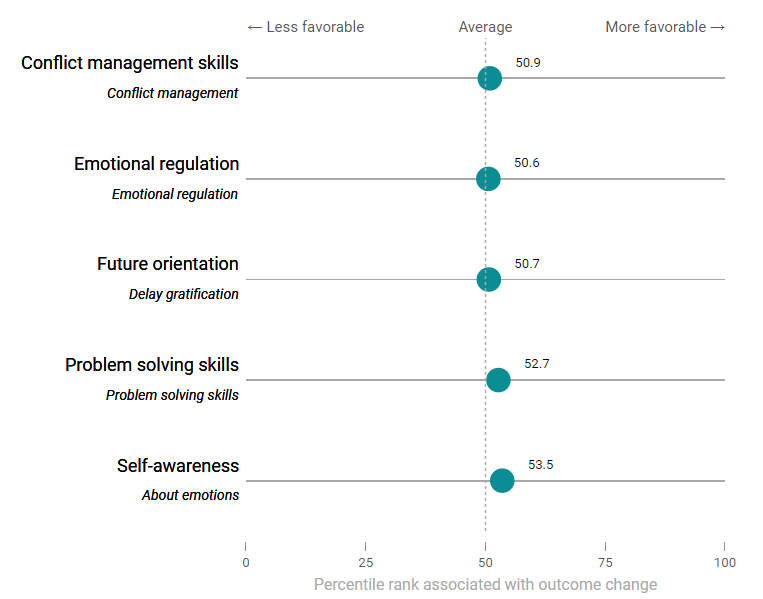
The location of a circle shows how large the improvement in the selected outcome would be given seven hours of dosage relative to all of the outcome changes we observed in the Components Study. In the default case, the selected components produced an improvement in Conflict management skills – Conflict management that was in the 50.9th percentile, which means that seven hours of dosage was associated with an outcome change larger than 50.9 percent of the changes in this outcome we saw in the study.
Let’s update our counts using the buttons on the right side of the graph. We’ll increase the hours of dosage from seven to eight, by pressing the + button:
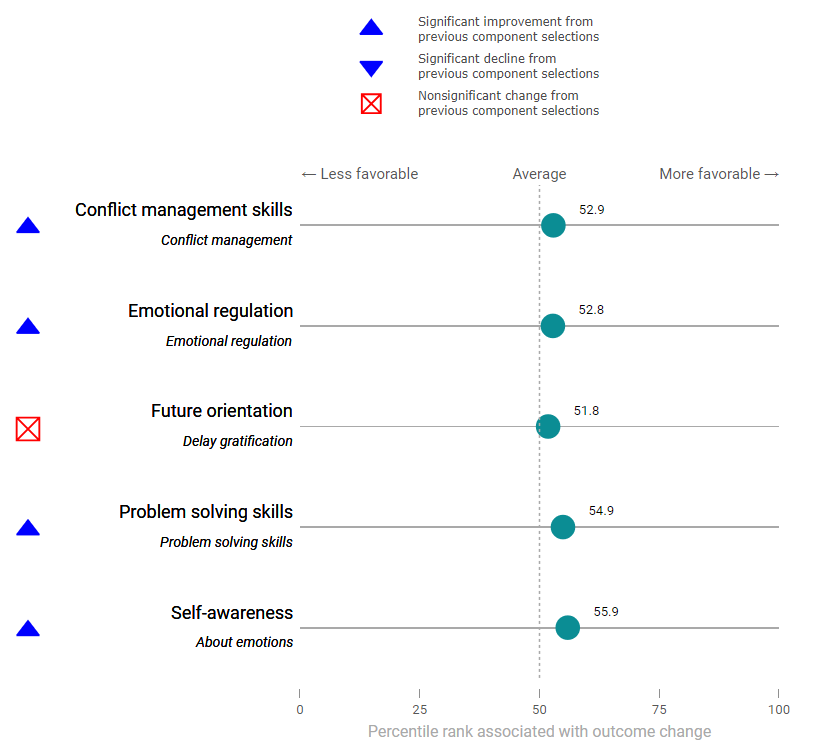
By changing the hours of dosage offered, the location of the circles in the graph has changed to reflect how the predicted outcome scores changed. As expected, adding one hour of dosage has had a favorable and significant improvement on several scales. For example, the location of the circle for Conflict management skills - Conflict management has shifted to the right to reflect the benefit of more dosage. The graph also shows an up arrow next to Conflict management skills - Conflict management , which signifies that the change in dosage is associated with a statistically significant favorable improvement in this outcome relative to seven hours of dosage.
You can continue to add (or subtract) hours of dosage, until you reach the maximum and minimum values that we observed in the Components Study (the buttons will turn grey at these thresholds). You can also change the type of components you’re interested in by clicking the Component tab on the right, selecting Activities or Content, and updating the number of lessons offered for a component category. This will enable you to see how different collections of components of different types (beyond dosage) also relate to outcomes.
In addition, you can change the outcomes that you would like to predict by clicking on the Outcomes tab on the right and selecting up to six outcomes you might want to predict.
This example highlights how selecting different collections of components can produce different levels of improvement across outcomes. We hope that it illustrates the connection between components and outcomes as observed in the Components Study.
